本日のボツスクリプト
YAPC::ASIA Tokyo 2011で「Perl meets beats.」を話したときに、
「フィルターはあるのかな?」みたいなツイートを見かけて以来、
ずっとやらなきゃなーって思ってて、結果的に作り直してるんだけど、
そのうち、フィルターの部分はできたと思う。
リポジトリはこちら。
https://github.com/techno-cat/p5-Cassis
んでもって、ボツスクリプト。
use v5.14;
use strict;
use warnings;

use Cassis;
use Math::Trig qw(pi tan);
use List::Util qw(max min);
use constant N => 1000;

use Imager;

# see also "Imager::Font"
my $font_size = 12;
my $font = Imager::Font->new(
    file => '/Library/Fonts/Osaka.ttf' ) or die;

my $cutoff = 0.2;
my $q = 2.5;

my @graph_params = (
    { type => 'LPF', params => Cassis::Iir2::LPF->new( cutoff => $cutoff, q => $q )->params() },
    { type => 'HPF', params => Cassis::Iir2::HPF->new( cutoff => $cutoff, q => $q )->params() },
    { type => 'BPF', params => Cassis::Iir2::BPF->new( cutoff => $cutoff, q => $q )->params() },
    { type => 'BEF', params => Cassis::Iir2::BEF->new( cutoff => $cutoff, q => $q )->params() }
);

foreach ( @graph_params ) {
    my $type = $_->{type};
    my $params = $_->{params};
    my $title = sprintf( "%s ( Cutoff: %.3f, Q: %.3f )", $type, $cutoff, $q );

    print "=== $title ===\n";
    foreach my $key ( qw/b0 b1 b2 a1 a2/ ) {
        printf( "%s: %6.3f\n", $key, $params->{$key} );
    }

    my @graph_src = map {
        my $f = $_ / N;
        my $gain = calc_gain( $f, $params );
        { f => $f, gain => $gain };
    } 0..(N / 2);

    my $img = draw_amplitude_spectrum( \@graph_src, $title );
    $img->write( file => "amplitude_spectrum_$type.png" ) or die $img->errstr;
}

sub draw_amplitude_spectrum {
    my ( $graph_src, $title ) = @_;

    my %margin = ( left => 30, top => 20, right => 20, bottom => 20 );
    my $tick_gain = 100;
    my $graph_width = scalar(@{$graph_src}) + 1;
    my $graph_height = 400 + 1;
    my $width = $margin{left} + $graph_width + 1 + $margin{right};
    my $height = $margin{top} + $graph_height + 1 + $margin{bottom};

    my $img = Imager->new(
        xsize => $width, ysize => $height );
    $img->box( filled => 1, color => 'black' );

    $img->align_string(
        x => $width / 2,
        y => 2,
        halign => 'center',
        valign => 'top',
        string => $title,
        font => $font,
        color => 'white',
        size => $font_size );

    my $x0 = $margin{left};
    my $y0 = $margin{top} + $graph_height - 1;

    my $x = 0;
    my $x_step = ($graph_width - 1) / 10;
    while ( $x < $graph_width ) {
        $img->line( color => 'white',
            x1 => $x0 + $x, y1 => $y0,
            x2 => $x0 + $x, y2 => $y0 - ($graph_height - 1) );

        $img->align_string(
            x => $x0 + $x,
            y => $y0 + 5,
            halign => 'center',
            valign => 'top',
            string => sprintf( "%.2f", ($x / ($graph_width - 1)) * 0.5 ),
            font => $font,
            color => 'white',
            size => $font_size );

        $x += $x_step;
    }

    my $y = 0;
    while ( $y < $graph_height ) {
        $img->line( color => 'white',
            x1 => $x0,                      y1 => $y0 - $y,
            x2 => $x0 + ($graph_width - 1), y2 => $y0 - $y );

        if ( 0 < $y ) {
            $img->align_string(
                x => $x0 - 5,
                y => $y0 - $y + int($font_size * 0.4),
                halign => 'right',
                valign => 'baseline',
                string => sprintf( "%.1f", $y / $tick_gain ),
                font => $font,
                color => 'white',
                size => $font_size );
        }

        $y += $tick_gain / 2;
    }

    $x = 0;
    foreach ( @{$graph_src} ) {
        my $f = $_->{f};
        my $gain = $_->{gain};

        $img->setpixel( color => 'red',
            x => $x0 + $x, y => $y0 - int(($gain * $tick_gain) + 0.5) );
        $x++;
    }

    return $img;
}

sub calc_gain {
    my ( $w, $params ) = @_;

    # H(z) = (b0 + b1 * z^-1 + b2 * z^-2) / (1 + a1 * z^-1 + a2 * z^-2)
    # z^1  = e^(jw)  = cos(w) + j*sin(w)
    # z^-1 = e^(-jw) = cos(w) - j*sin(w)

    # H(jw) = {(A-jB) * (C+jD)} / {(C-jD) * (C+jD)} = {(AC + BD) + j(AD - BC)} / (C^2 + D^2)
    # |H(jw)| = sqrt( (AC + BD)^2 + (AD - BC)^2 ) / (C^2 + D^2)

    my ( $b0, $b1, $b2, $a1, $a2 ) = map { $params->{$_}; } qw(b0 b1 b2 a1 a2);
    my $sin_w = sin( 2.0 * pi * $w );
    my $sin_2w = sin( 2.0 * pi * 2.0 * $w );
    my $cos_w = cos( 2.0 * pi * $w );
    my $cos_2w = cos( 2.0 * pi * 2.0 * $w );

    my $largeA = $b0 + ($b1 * $cos_w) + ($b2 * $cos_2w);
    my $largeB = ($b1 * $sin_w) + ($b2 * $sin_2w);
    my $largeC = 1.0 + ($a1 * $cos_w) + ($a2 * $cos_2w);
    my $largeD = ($a1 * $sin_w) + ($a2 * $sin_2w);

    my $AC_plus_BD = ($largeA * $largeC) + ($largeB * $largeD);
    my $AD_minus_BC = ($largeA * $largeD) - ($largeB * $largeC);
    my $d = ($largeC * $largeC) + ($largeD * $largeD);

    my $gain = sqrt(($AC_plus_BD * $AC_plus_BD) + ($AD_minus_BC * $AD_minus_BC)) / $d;

    return $gain;
}
OSによって、フォントの指定方法が違うみたいのがあって、
これをサンプルとして入れるのは諦めた。
その代わり、振幅特性を数字で出力するスクリプトを同梱することにした。
という訳で、Win32の人はImager::Fontを参考に、
$fontの初期化方法を書き直して貰うとして、
Macの人はこちらの記事を見て貰うとして、
あとは分かんないです、ごめんなさい。
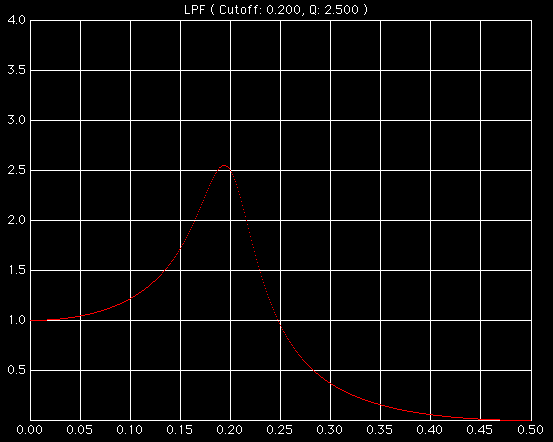
ちなみに、自分の環境だと、こんな感じのグラフが出力される。
2014/10/28 追記
今日時点でのCassisで動作するようにコードを変更。
おしまい。
Leave a Comment